Gain deeper insight into your data
Free Trial
Available
Pricing Plans
Grapher $539.00 $539.00 per user
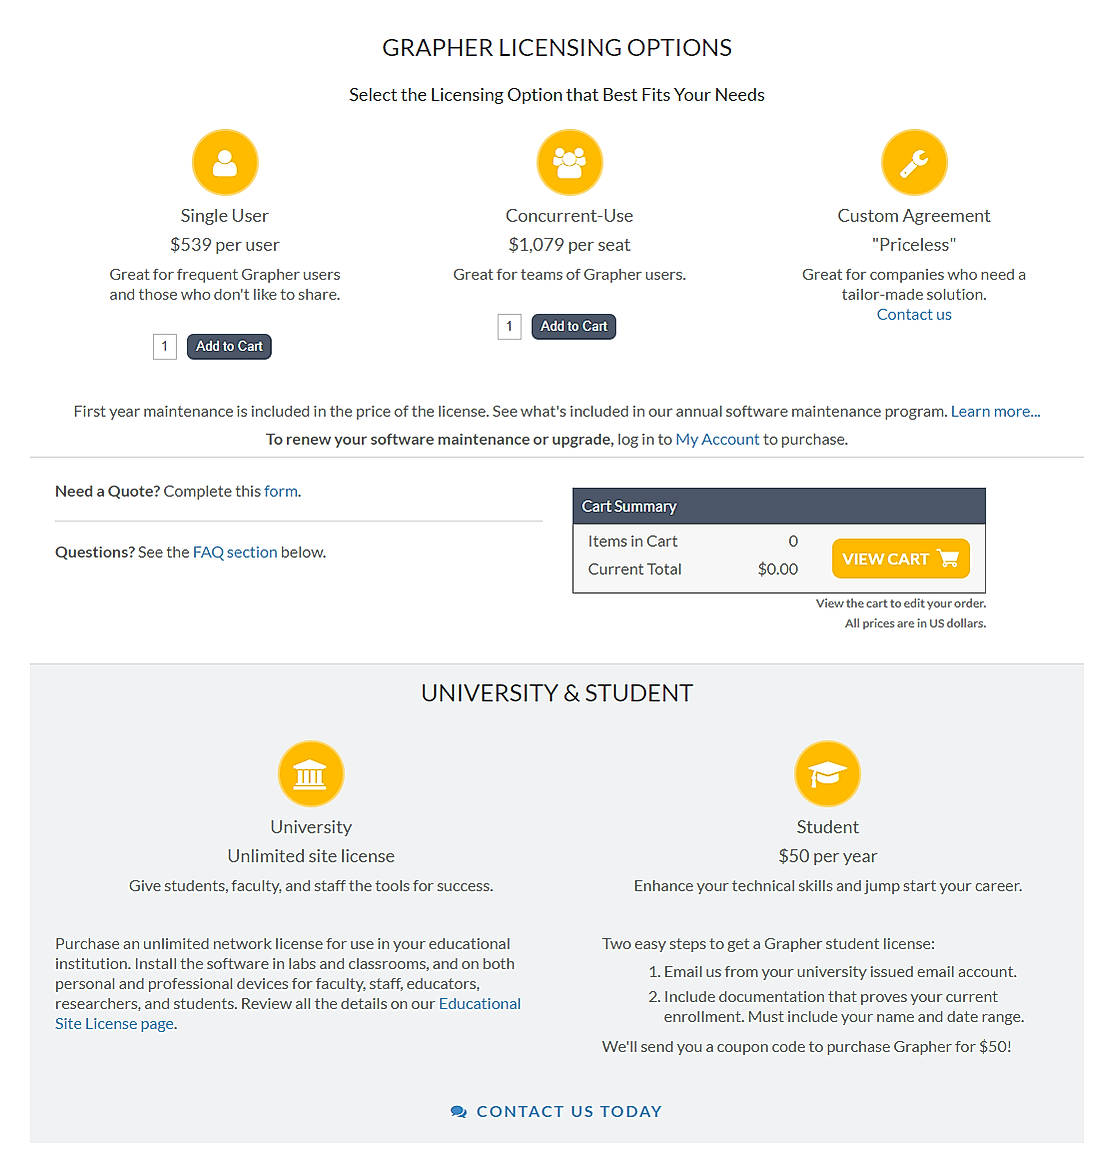
Single User: $539 per user
Concurrent-Use: $1,079 per seat
University & Student $50.00 $50.00 per year
Student: $50 per year
Features
Screenshots of Vendor Pricing Page
Disclaimer: The pricing details were last updated on 12/11/2020 from the vendor website and may be different from actual. Please confirm with the vendor website before purchasing.
How much does Grapher cost?
The pricing for Grapher starts at $50.00 per year. Grapher has 2 different plans:
Learn more about Grapher pricing.
Does Grapher offer a free plan?
No, Grapher does not offer a free plan.
Learn more about Grapher pricing.
| Product Name | Starting Price ($) | Billed | Unit | Free Trial | Learn More |
|---|---|---|---|---|---|
|
|
50 | per year | - | Grapher Pricing | |
|
|
150 | per year | - | DataSquirrel Pricing | |
|
|
- | - | - | SAS Advanced Analytics Pricing | |
|
|
167 | per month | - | dataSights Pricing | |
|
|
9.99 | per month | - | SharpDash Pricing | |
|
|
- | - | - | SAS Business Intelligence Pricing | |
|
|
19 | per month | - | Quickmetrics Pricing | |
|
|
29 | per month | - | Easy Insight Pricing | |
|
|
0.1 | - | - | Statsig Pricing | |
|
|
24.16 | per month | - | Chartbrew Pricing |
81% SW Score The SW Score ranks the products within a particular category on a variety of parameters, to provide a definite ranking system. Read more
84% SW Score The SW Score ranks the products within a particular category on a variety of parameters, to provide a definite ranking system. Read more
83% SW Score The SW Score ranks the products within a particular category on a variety of parameters, to provide a definite ranking system. Read more
86% SW Score The SW Score ranks the products within a particular category on a variety of parameters, to provide a definite ranking system. Read more
78% SW Score The SW Score ranks the products within a particular category on a variety of parameters, to provide a definite ranking system. Read more
Charting
Create a patient chart with all the vital information in one concise view about the patient careData Analysis
Analysis of raw data and converting them into useful reportsReports
Comes with reporting capabilities and features custom pre-built reportsGraphical User Interface
An user interface that allows the use of graphical elements such as icons and buttons to interact with electronic devicesCollaboration
Helps you safely share data with only those who matter and enhances your teamworkImage Exporting
Supports export of graphical data at different sizes and formatPDF Export
Enables to export the document to PDF file for easy sharingLooking for the right SaaS
We can help you choose the best SaaS for your specific requirements. Our in-house experts will assist you with their hand-picked recommendations.
Want more customers?
Our experts will research about your product and list it on SaaSworthy for FREE.