Free Trial
Available
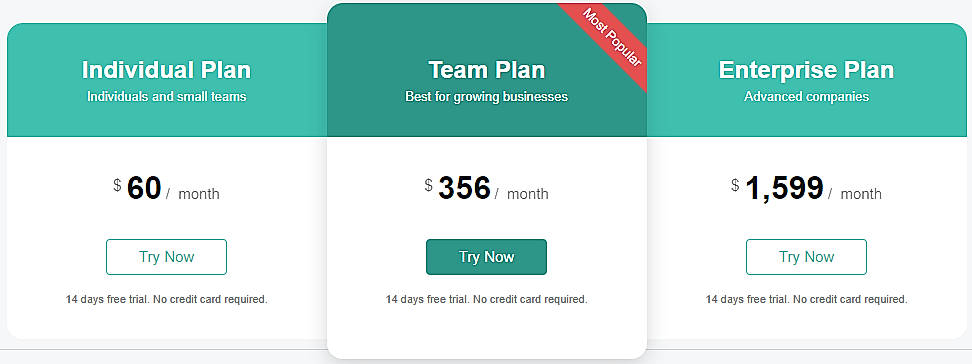
The Average Cost of a basic Business Intelligence Software plan is $62 per month.
Visualr pricing starts at $60/month, which is 3% lower than similar services.
53% of Business Intelligence Software offer a Free Trial , while 23% offer a Freemium Model .
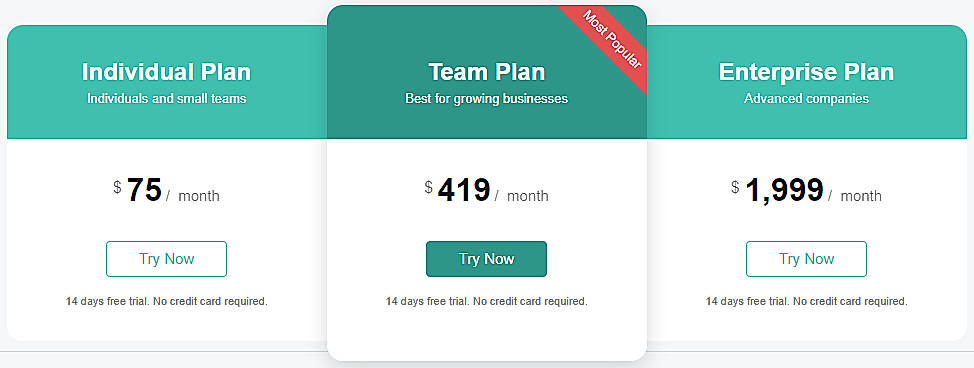
Individual Plan $60.00 $75.00 per month
Individuals and small teams
Features
Team Plan $356.00 $419.00 per month
Best for growing businesses
Features
Enterprise Plan $1,599.00 $1,999.00 per month
Advanced companies
Features
Screenshots of Vendor Pricing Page


Disclaimer: The pricing details were last updated on 26/05/2020 from the vendor website and may be different from actual. Please confirm with the vendor website before purchasing.
How much does Visualr cost?
The pricing for Visualr starts at $60.00 per month. Visualr has 3 different plans:
Learn more about Visualr pricing.
Does Visualr offer a free plan?
No, Visualr does not offer a free plan.
Learn more about Visualr pricing.
| Product Name | Starting Price ($) | Billed | Unit | Free Trial | Learn More |
|---|---|---|---|---|---|
|
|
60 | per month | - | Visualr Pricing | |
|
|
- | - | - | WovVBI Pricing | |
|
|
167 | per month | - | dataSights Pricing | |
|
|
500 | per month | - | Panintelligence Pricing | |
|
|
29 | per month | - | Easy Insight Pricing | |
|
|
- | - | - | Dundas BI Pricing | |
|
|
- | - | - | SAS Business Intelligence Pricing | |
|
|
- | - | - | Entrinsik Informer Pricing | |
|
|
- | - | - | ibi Analytics Platform Pricing | |
|
|
10 | per month | per user | Microsoft Power BI Pricing |
98% SW Score The SW Score ranks the products within a particular category on a variety of parameters, to provide a definite ranking system. Read more

95% SW Score The SW Score ranks the products within a particular category on a variety of parameters, to provide a definite ranking system. Read more
95% SW Score The SW Score ranks the products within a particular category on a variety of parameters, to provide a definite ranking system. Read more
94% SW Score The SW Score ranks the products within a particular category on a variety of parameters, to provide a definite ranking system. Read more

90% SW Score The SW Score ranks the products within a particular category on a variety of parameters, to provide a definite ranking system. Read more
86% SW Score The SW Score ranks the products within a particular category on a variety of parameters, to provide a definite ranking system. Read more
86% SW Score The SW Score ranks the products within a particular category on a variety of parameters, to provide a definite ranking system. Read more
86% SW Score The SW Score ranks the products within a particular category on a variety of parameters, to provide a definite ranking system. Read more
85% SW Score The SW Score ranks the products within a particular category on a variety of parameters, to provide a definite ranking system. Read more
71% SW Score The SW Score ranks the products within a particular category on a variety of parameters, to provide a definite ranking system. Read more
81% SW Score The SW Score ranks the products within a particular category on a variety of parameters, to provide a definite ranking system. Read more
89% SW Score The SW Score ranks the products within a particular category on a variety of parameters, to provide a definite ranking system. Read more
84% SW Score The SW Score ranks the products within a particular category on a variety of parameters, to provide a definite ranking system. Read more
90% SW Score The SW Score ranks the products within a particular category on a variety of parameters, to provide a definite ranking system. Read more
87% SW Score The SW Score ranks the products within a particular category on a variety of parameters, to provide a definite ranking system. Read more

89% SW Score The SW Score ranks the products within a particular category on a variety of parameters, to provide a definite ranking system. Read more

86% SW Score The SW Score ranks the products within a particular category on a variety of parameters, to provide a definite ranking system. Read more

98% SW Score The SW Score ranks the products within a particular category on a variety of parameters, to provide a definite ranking system. Read more

Trend Indicators
Helps you in understanding the present situation and where your business is heading so that you can make decisions accordingly.Strategic Planning
Defining future strategy or direction based on well-detailed reports and forecasts.Profitability Analysis
Forecasting the profitability of any particular proposal or optimizing the profitability of an existing projectKey Performance Indicators
Evaluating and measuring the performance of the business which will help you make informed decisions and correcting past mistakesData Analysis
Helps in analyzing stored raw data and converting them into useful reportsDashboard
A digital insight of reports and other workings on a single screenBenchmarking
Setting up standards and targets for your team and team members, so that they are performing at their bestAd hoc Reports
Creates impromptu reports as and when the occasion requiresAd hoc Query
Helps in answering a query as and when it arisesAd hoc Analysis
A statistical model, analytical report or any other type of data summary particularly designed to answer a single, specific business question.
Looking for the right SaaS
We can help you choose the best SaaS for your specific requirements. Our in-house experts will assist you with their hand-picked recommendations.

Want more customers?
Our experts will research about your product and list it on SaaSworthy for FREE.