Microsoft Power BI |
78% SW Score The SW Score ranks the products within a particular category on a variety of parameters, to provide a definite ranking system. Read more
Get Free Advice
|
75% SW Score The SW Score ranks the products within a particular category on a variety of parameters, to provide a definite ranking system. Read more
Get Free Advice
|
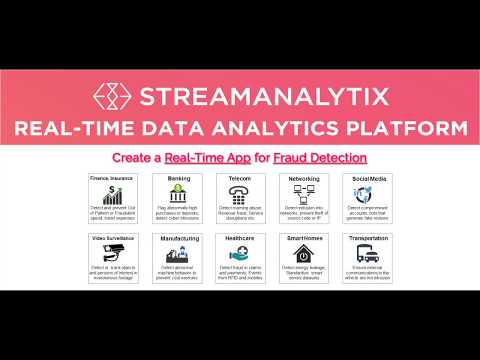
| Description | StreamAnalytix is multi-engine, open source-based, visual Big Data analytics Platform for stream processing and machine learning. Leveraging on a multi-engine support, StreamAnalytix can rapidly build and deploy streaming analytics application for use in any industry, any data format and any use case with top notch open-source technology both on-premise and in the cloud. You can easily build models using a complete set of machine learning operators and the model’s performance can be tested and scored on real-time data. Its intuitive UI offers ease and power of a visual IDE to provide a complete big data processing platform for data ingestion and analytics, machine learning and data visualization. You can absorb big data flows into your data lake from any batch or streaming data source. StreamAnalytix simplifies the data stream processing with its user friendly UI to help developers to quickly and easily configure and deploy new workflows. Its pre-built application accelerators gives data scientists the ability to also build custom visualizations easily to help users create powerful business solutions and increase operational efficiency with the aid of static and streaming data. Read more | VisioChart is the ultimate solution to making their data come to life in Power BI. If they're tired of staring at dull and dry data sets, VisioChart is here to revolutionize the way you interpret and present their information. With VisioChart Custom Visuals, user can explore and discover the perfect visuals to complement their data in Power BI. No more generic charts and graphs, VisioChart offers a diverse range of customizable options that will make their reports stand out and make an impact. Designed with professionals in mind, VisioChart is the perfect tool for anyone looking to add a touch of creativity and engagement to their data-driven presentations. From marketing analysts to financial advisors, VisioChart has something for everyone. What sets VisioChart apart from other Power BI Custom Visuals is its user-friendly interface. Read more |
| Pricing Options |
|
|
| SW Score & Breakdown |
78% SW Score The SW Score ranks the products within a particular category on a variety of parameters, to provide a definite ranking system. Read more
|
75% SW Score The SW Score ranks the products within a particular category on a variety of parameters, to provide a definite ranking system. Read more
|
| Total Features |
6 Features
|
3 Features
|
| Common Features for All |
Dashboard
Data Analysis
Key Performance Indicators
Profitability Analysis
Strategic Planning
Trend Indicators
|
Dashboard
Data Analysis
Key Performance Indicators
Profitability Analysis
Strategic Planning
Trend Indicators
|
| Organization Types Supported |
|
|
| Platforms Supported |
|
|
| Modes of Support |
|
|
| Pricing Options |
|
|
|
Pricing Plans
Monthly Plans
Annual Plans
|
Cloud Trial Others StreamAnalytix Lite Free |
VisioChart Custom |
|
View Detailed Pricing
|
View Detailed Pricing
|
| Screenshots |

|
Not Available |
| Videos |
+ 2 More
|

+ 2 More
|
| Company Details | Located in: Los Gatos, CA | Located in: Burnley, United Kingdom - BB11 5JT |
| Contact Details |
Not available |
Not available |
| Social Media Handles |
|
|
Looking for the right SaaS
We can help you choose the best SaaS for your specific requirements. Our in-house experts will assist you with their hand-picked recommendations.
Want more customers?
Our experts will research about your product and list it on SaaSworthy for FREE.

