Google Data Studio |
92% SW Score The SW Score ranks the products within a particular category on a variety of parameters, to provide a definite ranking system. Read more
Get Free Advice
|
98% SW Score The SW Score ranks the products within a particular category on a variety of parameters, to provide a definite ranking system. Read more
Get Free Advice
|
| Description | Zoho Analytics (formerly, Zoho Reports) is a self-service business intelligence and analytics platform that helps you easily analyze your business data, and create insightful reports and dashboards for informed decision making. Transform huge amounts of raw data into actionable reports and dashboards. Zoho Analytics has deep expertise in catering to SMBs' BI and analytical requirements and, moreover, delivers them at an attractive price point. Get a powerful BI, reporting and analytics tool in your own brand name embedded within your own product, application, portal, or website. Read more | Microsoft Power BI is a data visualization platform that enables its users to create a data-driven culture equipped with business intelligence. The software helps its users to allow their employees at different organizational levels to use the up to the minute analytics in order to make quick and confident decisions. Users can share and create interactive data visuals throughout the data centers around the world, including the national clouds to hence meet the regulation and compliance requirements of the organization. Power BI allows its users to apply sensitivity labels that are recognizable through Office 365 apps such as Excel, Word, Outlook, and PowerPoint. The software allows its users to use the oversight of sensitive data through Microsoft Cloud App Security to ensure better compliance of regulatory and privacy requirements. Users can extend the governance and protection policies along with the exported data to the software with the help of Microsoft Information Protection. One can block risky user activities in real-time to prevent the exposure of sensitive data. Read more |
| Pricing Options |
|
|
| SW Score & Breakdown |
92% SW Score The SW Score ranks the products within a particular category on a variety of parameters, to provide a definite ranking system. Read more
|
98% SW Score The SW Score ranks the products within a particular category on a variety of parameters, to provide a definite ranking system. Read more
|
| SaaSworthy Awards | # 3 Highly Rated # 1 Fastest Growing | # 2 Most Worthy # 1 Highly Rated |
| Total Features |
8 Features
|
10 Features
|
| Common Features for All |
Ad hoc Analysis
Ad hoc Query
Ad hoc Reports
Benchmarking
Dashboard
Data Analysis
Key Performance Indicators
Profitability Analysis
Strategic Planning
Trend Indicators
|
Ad hoc Analysis
Ad hoc Query
Ad hoc Reports
Benchmarking
Dashboard
Data Analysis
Key Performance Indicators
Profitability Analysis
Strategic Planning
Trend Indicators
|
| Organization Types Supported |
|
|
| Platforms Supported |
|
|
| Modes of Support |
|
|
| API Support |
|
|
| User Rating |
|
|
| Rating Distribution |
|
|
| User Sentiments |
Ease of Use, Extensive Integrations, Customizable Reports, Comprehensive Dashboards Limited Data Visualization Options, Steep Learning Curve, Inadequate Data Transformation Capabilities, Occasional Performance Issues |
Data Visualization Capabilities, Extensive Data Source Integrations, Intuitive and User-Friendly Interface, Data Sharing and Collaboration Mobile App Functionality, Occasional Software Bugs, Pricing Model Limitations, Complex Interface for Beginners |
| Review Summary |
Zoho Analytics is a business intelligence and analytics platform that's praised for its user-friendly interface, comprehensive data visualization capabilities, and robust reporting functionality. It's often lauded for its affordability, ease of customization, and excellent customer support. However, some users have expressed concerns about its limited data integration options and occasional performance issues. Overall, Zoho Analytics is generally well-received by users who appreciate its user-friendly design, data visualization capabilities, and reporting functionality, but some find its data integration options lacking and performance inconsistent. |
Users appreciate Power BI's user-friendly interface, extensive data visualization options, and seamless integration with other Microsoft products. Many reviewers highlight its ability to transform raw data into insightful reports and dashboards, aiding in better decision-making. Additionally, Power BI's collaboration features and mobile accessibility receive positive feedback. However, some users mention occasional performance issues and a learning curve for advanced features. While praised for its affordability and value for money, certain users suggest enhancements in customer support. |
| Read All User Reviews | Read All User Reviews |
AI-Generated from the text of User Reviews
| Pricing Options |
|
|
|
Pricing Plans
Monthly Plans
Annual Plans
|
Basic $24.00 $30.00 per month Standard $48.00 $60.00 per month Premium $115.00 $145.00 per month Enterprise $455.00 $575.00 per month Personal (On-premise) Free Professional (On-premise) $30.00 $30.00 per user / month |
Free Account Free Power BI Pro $10.00 $10.00 per user / month Power BI Premium Per User $20.00 $20.00 per user / month Power BI Embedded Custom |
|
View Detailed Pricing
|
View Detailed Pricing
|
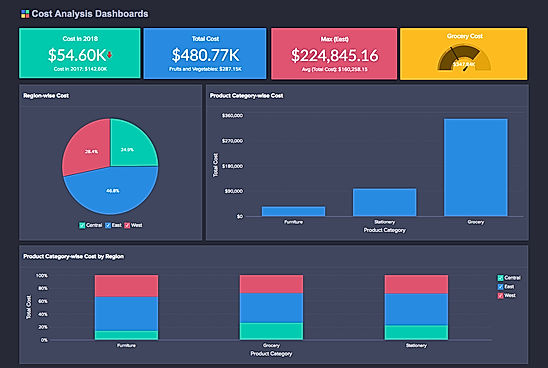
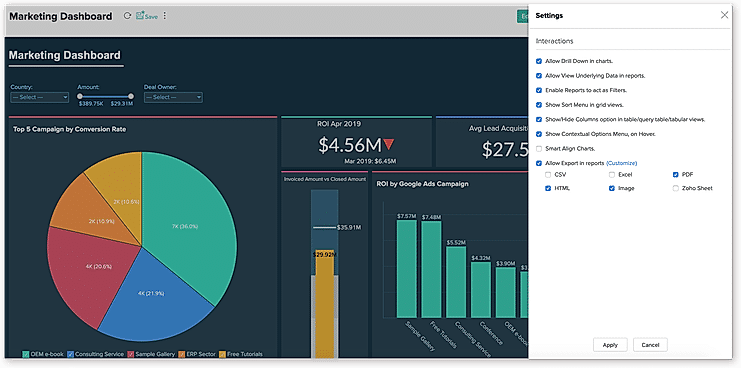
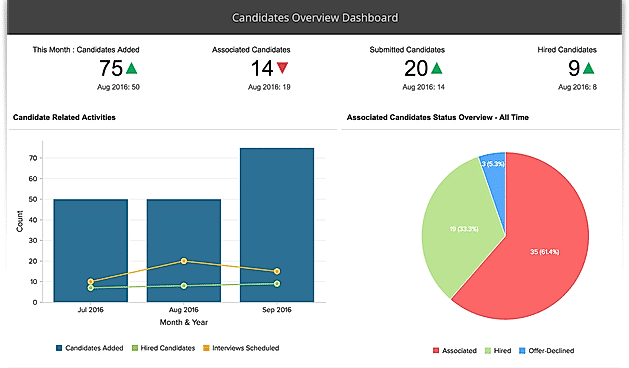
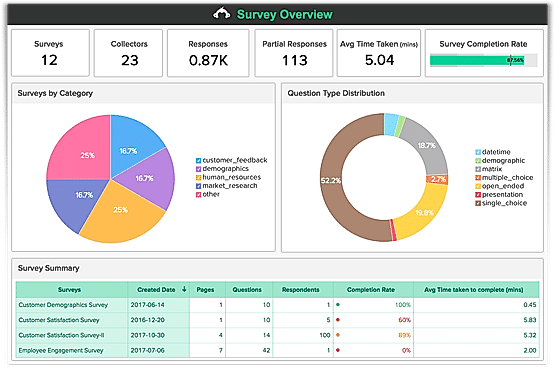
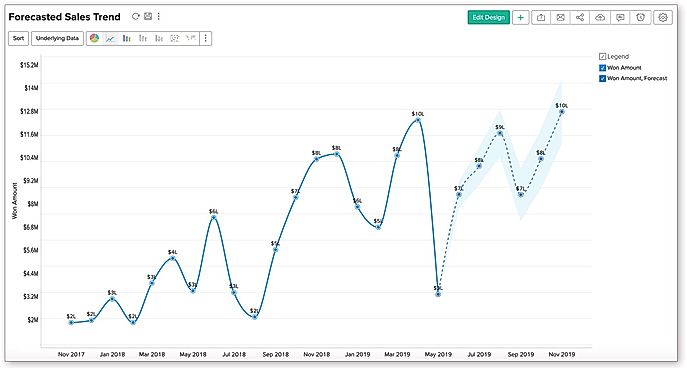
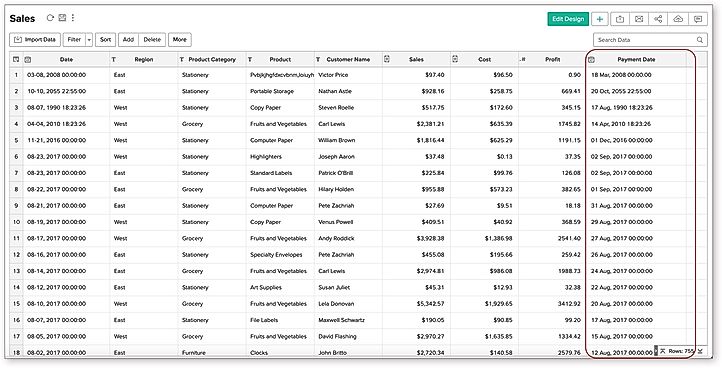
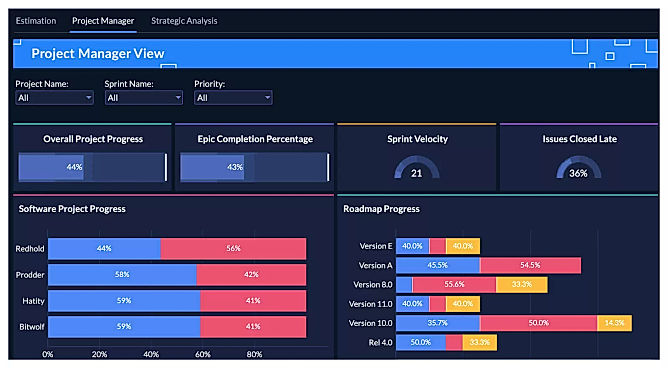
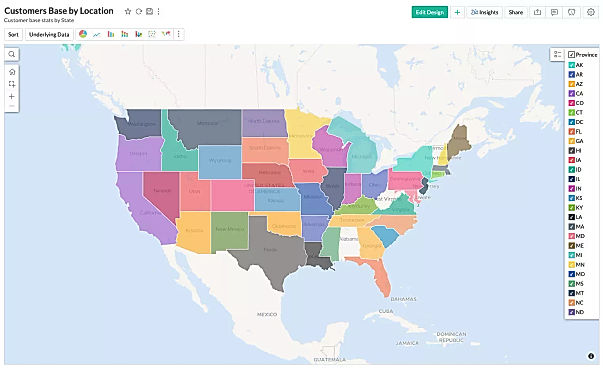
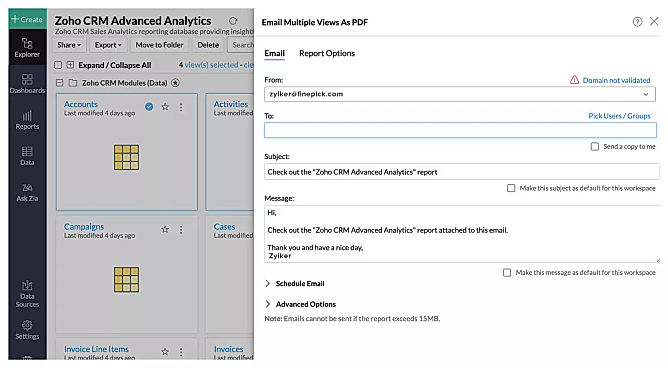
| Screenshots |
+ 9 More
|

+ 6 More
|
| Videos |

+ 3 More
|

+ 4 More
|
| Company Details | Located in: Pleasanton, California | Located in: Redmond, Washington Founded in: 2014 |
| Contact Details |
+1 (888) 900-9646 |
Not available https://www.microsoft.com/en-us/power-platform/products/power-bi/ |
| Social Media Handles |
|
|
Looking for the right SaaS
We can help you choose the best SaaS for your specific requirements. Our in-house experts will assist you with their hand-picked recommendations.
Want more customers?
Our experts will research about your product and list it on SaaSworthy for FREE.