Microsoft Power BI |
84% SW Score The SW Score ranks the products within a particular category on a variety of parameters, to provide a definite ranking system. Read more
Get Free Advice
|
83% SW Score The SW Score ranks the products within a particular category on a variety of parameters, to provide a definite ranking system. Read more
Get Free Advice
|
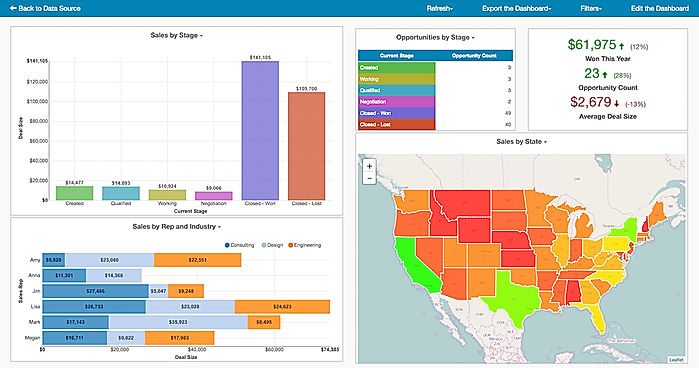
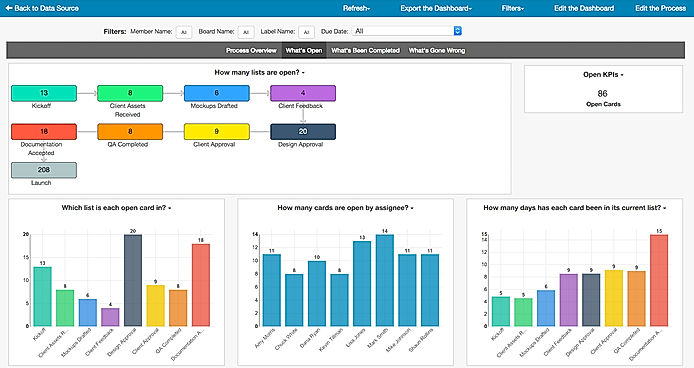
| Description | Vitally helps you improve customer retention by boosting your SaaS product subscription rates. This customer success platform provides you with the necessary insights to understand whether your customers are getting the most out of your product, and how to rectify any problems if they aren’t happy. Vitally allows you to track customers’ use of your product at a general level, as well as per feature, and per user. It provides alerts when your customers are at risk of churn, and assigns customer success agents to the case so they can follow up with the client. Vitally also creates customized customer reports so you can measure success and see how you are lining up with your KPIs. This also applies to free trials, as Vitally allows you to track the ROI of any trial program you offer, as well as keep on top of when the free trial period is due to end, and recurring subscription dates. Read more | Easy Insight software is a platform used to connect your cloud apps to gain insights with conversion rates. Create custom tables with different data sources to optimize the reporting across your entire business on unified data. Customize dashboards into your own site to optimize a seamless user experience. Set up recurring exports of your reports and dashboards by email. Small, Medium companies make use of the software. Read more |
| Pricing Options |
|
|
| SW Score & Breakdown |
84% SW Score The SW Score ranks the products within a particular category on a variety of parameters, to provide a definite ranking system. Read more
|
83% SW Score The SW Score ranks the products within a particular category on a variety of parameters, to provide a definite ranking system. Read more
|
| Total Features |
9 Features
|
5 Features
|
| Common Features for All |
Ad hoc Analysis
Ad hoc Reports
Benchmarking
Dashboard
Data Analysis
Key Performance Indicators
Profitability Analysis
Strategic Planning
Trend Indicators
|
Ad hoc Analysis
Ad hoc Reports
Benchmarking
Dashboard
Data Analysis
Key Performance Indicators
Profitability Analysis
Strategic Planning
Trend Indicators
|
| Organization Types Supported |
|
|
| Platforms Supported |
|
|
| Modes of Support |
|
|
| API Support |
|
|
| User Rating |
Not Available
|
|
| Rating Distribution |
Not Available
|
|
| Read All User Reviews |
AI-Generated from the text of User Reviews
| Pricing Options |
|
|
|
Pricing Plans
Monthly Plans
Annual Plans
|
Tech-Touch Custom Hybrid-Touch Custom High-Touch Custom |
Individual (For SaaS Reporting) $29.00 $29.00 per month Team (For SaaS Reporting) $49.00 $49.00 per month Professional (For SaaS Reporting) $149.00 $149.00 per month Premium (For Custom Data Business Intelligence) $299.00 $299.00 per month Enterprise (For Custom Data Business Intelligence) $499.00 $499.00 per month Unlimited (For Custom Data Business Intelligence) $1,499.00 $1,499.00 per month |
|
View Detailed Pricing
|
View Detailed Pricing
|
| Screenshots |

+ 4 More
|
+ 1 More
|
| Videos | Not Available |
+ 1 More
|
| Company Details | Located in: New York City, USA | Located in: Denver, CO Founded in: 2008 |
| Contact Details |
Not available |
+1 720-316-8174 |
| Social Media Handles |
|
|
Looking for the right SaaS
We can help you choose the best SaaS for your specific requirements. Our in-house experts will assist you with their hand-picked recommendations.
Want more customers?
Our experts will research about your product and list it on SaaSworthy for FREE.