Microsoft Power BI |
90% SW Score The SW Score ranks the products within a particular category on a variety of parameters, to provide a definite ranking system. Read more
Get Free Advice
|
75% SW Score The SW Score ranks the products within a particular category on a variety of parameters, to provide a definite ranking system. Read more
Get Free Advice
|
| Description | Spotfire combines advanced analytics and interactive visualizations to help professionals uncover insights that neither humans nor computers could achieve alone. It integrates visual analytics, data science, and data wrangling, allowing users to analyze data effortlessly—whether static, in motion, or at scale. With support for 80+ data sources, Spotfire simplifies complex data unification into an intuitive experience. Its AI-powered insights, including Spotfire Copilot™, use natural language to interpret and visualize data faster. Beyond analysis, Spotfire enables collaboration by letting users create analytic apps and securely share them for further customization. Built-in security, governance, and self-documenting workflows ensure regulatory compliance, while its flexibility supports specific business needs. Data scientists can enhance functionality by integrating R and Python. From geospatial analysis to predictive modeling, Spotfire delivers precision and scalability, empowering users to discover actionable insights faster while fostering collaboration across teams. Read more | VisioChart is the ultimate solution to making their data come to life in Power BI. If they're tired of staring at dull and dry data sets, VisioChart is here to revolutionize the way you interpret and present their information. With VisioChart Custom Visuals, user can explore and discover the perfect visuals to complement their data in Power BI. No more generic charts and graphs, VisioChart offers a diverse range of customizable options that will make their reports stand out and make an impact. Designed with professionals in mind, VisioChart is the perfect tool for anyone looking to add a touch of creativity and engagement to their data-driven presentations. From marketing analysts to financial advisors, VisioChart has something for everyone. What sets VisioChart apart from other Power BI Custom Visuals is its user-friendly interface. Read more |
| Pricing Options |
|
|
| SW Score & Breakdown |
90% SW Score The SW Score ranks the products within a particular category on a variety of parameters, to provide a definite ranking system. Read more
|
75% SW Score The SW Score ranks the products within a particular category on a variety of parameters, to provide a definite ranking system. Read more
|
| SaaSworthy Awards | # 6 Highly Rated # 7 Fastest Growing |
Not Available
|
| Total Features |
9 Features
|
3 Features
|
| Common Features for All |
Ad hoc Analysis
Ad hoc Reports
Benchmarking
Dashboard
Data Analysis
Key Performance Indicators
Profitability Analysis
Strategic Planning
Trend Indicators
|
Ad hoc Analysis
Ad hoc Reports
Benchmarking
Dashboard
Data Analysis
Key Performance Indicators
Profitability Analysis
Strategic Planning
Trend Indicators
|
| Organization Types Supported |
|
|
| Platforms Supported |
|
|
| Modes of Support |
|
|
| API Support |
|
|
| User Rating |
|
Not Available
|
| Rating Distribution |
|
Not Available
|
| Read All User Reviews |
AI-Generated from the text of User Reviews
| Pricing Options |
|
|
|
Pricing Plans
Monthly Plans
Annual Plans
|
Spotfire Custom |
VisioChart Custom |
|
View Detailed Pricing
|
View Detailed Pricing
|
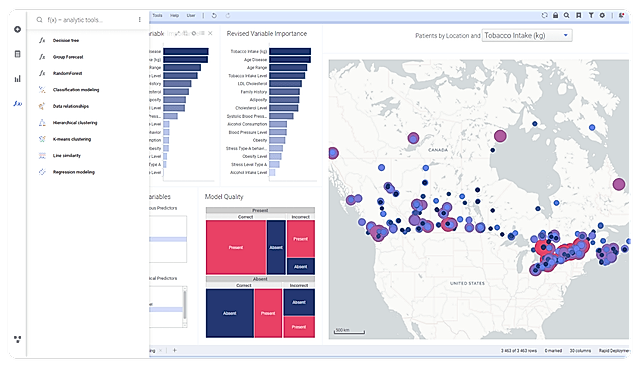
| Screenshots |
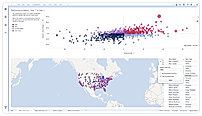
+ 4 More
|
Not Available |
| Videos |
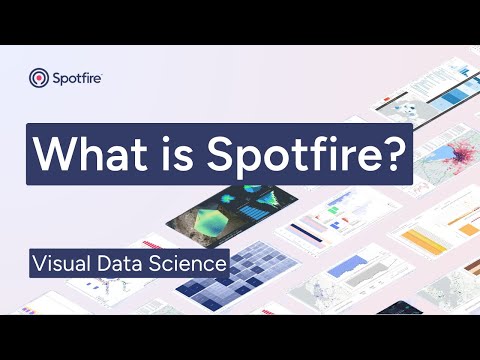
+ 1 More
|

+ 2 More
|
| Company Details | Located in: Fort Lauderdale, FL - 33309 | Located in: Burnley, United Kingdom - BB11 5JT |
| Contact Details |
Not available |
Not available |
| Social Media Handles |
|
|
Looking for the right SaaS
We can help you choose the best SaaS for your specific requirements. Our in-house experts will assist you with their hand-picked recommendations.
Want more customers?
Our experts will research about your product and list it on SaaSworthy for FREE.