Microsoft Power BI |
85% SW Score The SW Score ranks the products within a particular category on a variety of parameters, to provide a definite ranking system. Read more
Get Free Advice
|
75% SW Score The SW Score ranks the products within a particular category on a variety of parameters, to provide a definite ranking system. Read more
Get Free Advice
|
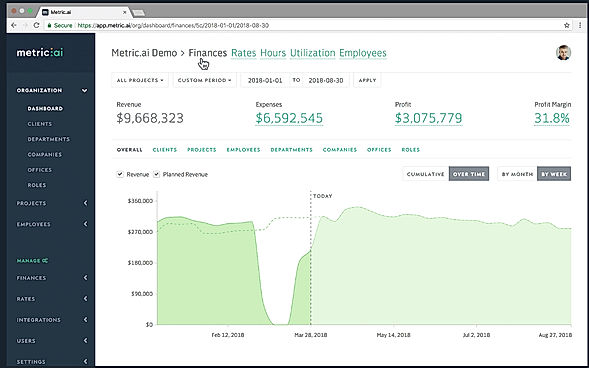
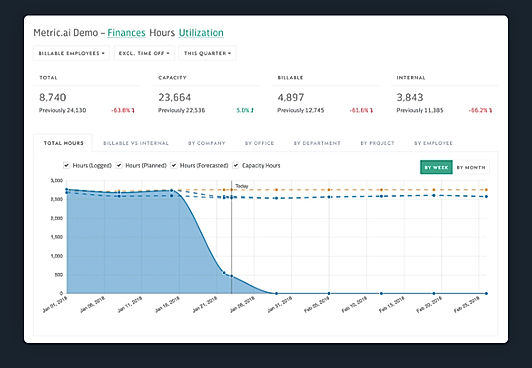
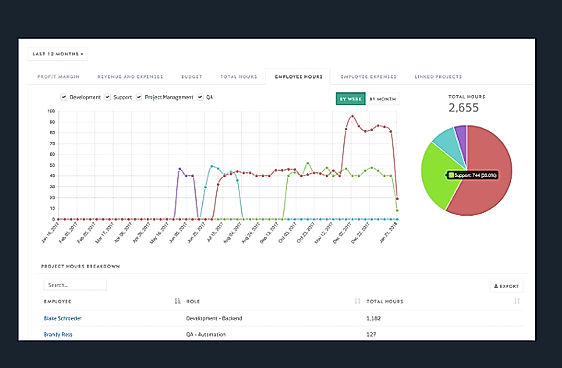
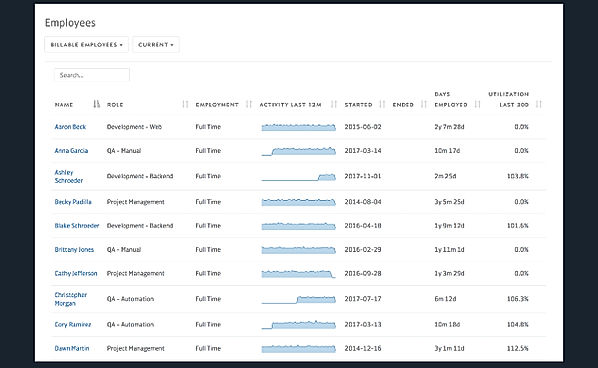
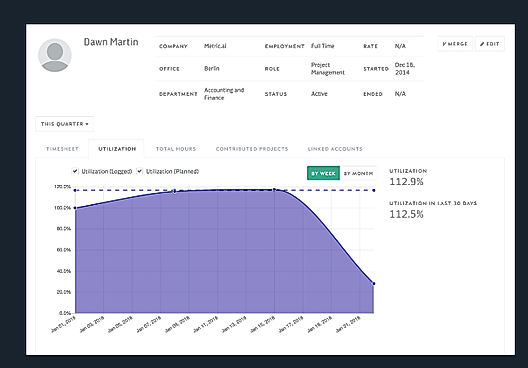
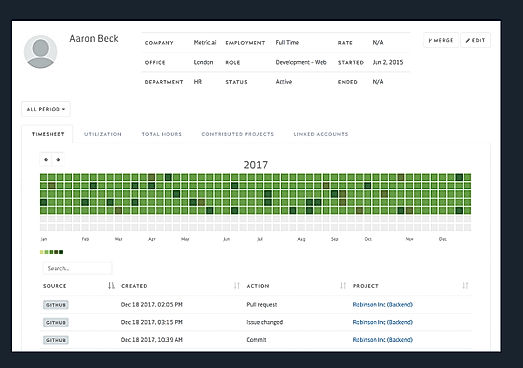
| Description | Metric.ai allows you to bring together all the disparate but important data you collect on your customers from systems such as your CRM, project management tools, development environment, accounting system, and time tracking software into one place. Metric.ai’s analytics engine then aggregates this data and analyzes it to help you track and report on key business metrics. These metrics include revenue and profit, profit margin, expenses, and employee turnover, and they are segmented by office, company, project, department, client, role, and employee. This then allows you to get insight and recommendations that you can take action on. The software includes a number of dashboards for different functions and roles, including finance and accounting, HR, workforce management, and operations. It also provides insight into cost rates management, billable rates management, and revenue recognition. Metric.ai allows you to give different access rights to employees depending on their roles. Read more | VisioChart is the ultimate solution to making their data come to life in Power BI. If they're tired of staring at dull and dry data sets, VisioChart is here to revolutionize the way you interpret and present their information. With VisioChart Custom Visuals, user can explore and discover the perfect visuals to complement their data in Power BI. No more generic charts and graphs, VisioChart offers a diverse range of customizable options that will make their reports stand out and make an impact. Designed with professionals in mind, VisioChart is the perfect tool for anyone looking to add a touch of creativity and engagement to their data-driven presentations. From marketing analysts to financial advisors, VisioChart has something for everyone. What sets VisioChart apart from other Power BI Custom Visuals is its user-friendly interface. Read more |
| Pricing Options |
|
|
| SW Score & Breakdown |
85% SW Score The SW Score ranks the products within a particular category on a variety of parameters, to provide a definite ranking system. Read more
|
75% SW Score The SW Score ranks the products within a particular category on a variety of parameters, to provide a definite ranking system. Read more
|
| Total Features |
9 Features
|
3 Features
|
| Common Features for All |
Ad hoc Analysis
Ad hoc Reports
Benchmarking
Dashboard
Data Analysis
Key Performance Indicators
Profitability Analysis
Strategic Planning
Trend Indicators
|
Ad hoc Analysis
Ad hoc Reports
Benchmarking
Dashboard
Data Analysis
Key Performance Indicators
Profitability Analysis
Strategic Planning
Trend Indicators
|
| Organization Types Supported |
|
|
| Platforms Supported |
|
|
| Modes of Support |
|
|
| User Rating |
|
Not Available
|
| Rating Distribution |
|
Not Available
|
| Read All User Reviews |
AI-Generated from the text of User Reviews
| Pricing Options |
|
|
|
Pricing Plans
Monthly Plans
Annual Plans
|
Metric.ai Custom |
VisioChart Custom |
|
View Detailed Pricing
|
View Detailed Pricing
|
| Screenshots |
+ 5 More
|
Not Available |
| Videos |

|

+ 2 More
|
| Company Details | Located in: San Francisco, CA | Located in: Burnley, United Kingdom - BB11 5JT |
| Contact Details |
Not available |
Not available |
| Social Media Handles |
|
|
Looking for the right SaaS
We can help you choose the best SaaS for your specific requirements. Our in-house experts will assist you with their hand-picked recommendations.
Want more customers?
Our experts will research about your product and list it on SaaSworthy for FREE.