Microsoft Power BI |
79% SW Score The SW Score ranks the products within a particular category on a variety of parameters, to provide a definite ranking system. Read more
Get Free Advice
|
75% SW Score The SW Score ranks the products within a particular category on a variety of parameters, to provide a definite ranking system. Read more
Get Free Advice
|
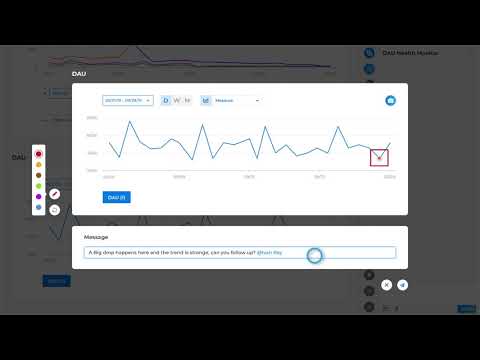
| Description | Kubit’s Smart Analytics helps teams improve product performance through a better understanding of customer needs, and allows them to seamlessly track, report, and share the thought process from start to finish. Improve product performance by a better understanding of customer needs. Enhance understanding of outliers, market shifts, and customer needs in real-time. Seamlessly track, report and share the thought process with a visual path from Query to Solution. Investigate data within richer contexts and accurately assess any scenarios to Identify Pain Points that Matter the Most. Read more | VisioChart is the ultimate solution to making their data come to life in Power BI. If they're tired of staring at dull and dry data sets, VisioChart is here to revolutionize the way you interpret and present their information. With VisioChart Custom Visuals, user can explore and discover the perfect visuals to complement their data in Power BI. No more generic charts and graphs, VisioChart offers a diverse range of customizable options that will make their reports stand out and make an impact. Designed with professionals in mind, VisioChart is the perfect tool for anyone looking to add a touch of creativity and engagement to their data-driven presentations. From marketing analysts to financial advisors, VisioChart has something for everyone. What sets VisioChart apart from other Power BI Custom Visuals is its user-friendly interface. Read more |
| Pricing Options |
|
|
| SW Score & Breakdown |
79% SW Score The SW Score ranks the products within a particular category on a variety of parameters, to provide a definite ranking system. Read more
|
75% SW Score The SW Score ranks the products within a particular category on a variety of parameters, to provide a definite ranking system. Read more
|
| Total Features |
6 Features
|
3 Features
|
| Common Features for All |
Ad hoc Reports
Benchmarking
Dashboard
Data Analysis
Key Performance Indicators
Trend Indicators
|
Ad hoc Reports
Benchmarking
Dashboard
Data Analysis
Key Performance Indicators
Trend Indicators
|
| Organization Types Supported |
|
|
| Platforms Supported |
|
|
| Modes of Support |
|
|
| Pricing Options |
|
|
|
Pricing Plans
Monthly Plans
Annual Plans
|
Free Free Starter $4,999.00 $4,999.00 per month Growth $7,999.00 $7,999.00 per month Enterprise Custom |
VisioChart Custom |
|
View Detailed Pricing
|
View Detailed Pricing
|
| Screenshots |

|
Not Available |
| Videos |
+ 2 More
|

+ 2 More
|
| Company Details | Located in: Fremont, California | Located in: Burnley, United Kingdom - BB11 5JT |
| Contact Details |
Not available |
Not available |
| Social Media Handles |
|
|
Looking for the right SaaS
We can help you choose the best SaaS for your specific requirements. Our in-house experts will assist you with their hand-picked recommendations.
Want more customers?
Our experts will research about your product and list it on SaaSworthy for FREE.

