Microsoft SQL Server |
93% SW Score The SW Score ranks the products within a particular category on a variety of parameters, to provide a definite ranking system. Read more
Get Free Advice
|
79% SW Score The SW Score ranks the products within a particular category on a variety of parameters, to provide a definite ranking system. Read more
Get Free Advice
|
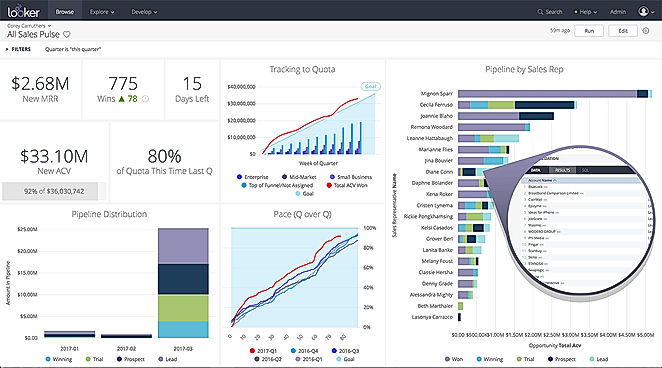
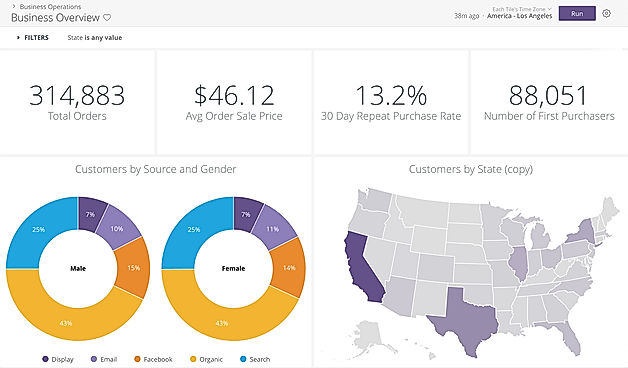
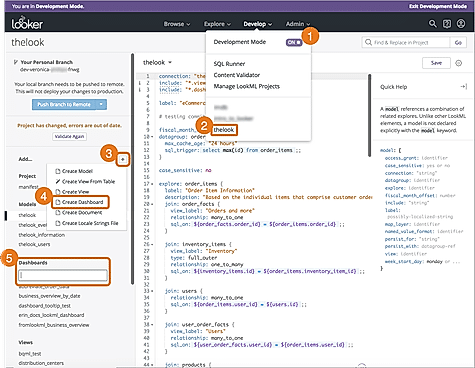
| Description | Looker is a business intelligence and data visualization platform that aims to provide everyone with access to useful data in a unified view in an easy-to-understand format through its centralized platform. Looker’s pre-built applications and blocks can help your company get up and running quicker by speeding up the process of customization. Looker’s LookML data modeling language gives data analysts a way to define business metrics, as well as find correlations between data and tables. Looker’s data visualization features lets you build more beautiful ways to display your data, that can be understand by both data scientists and business users alike. Its reports and dashboards let you drill down into key metrics so you can get a better understanding of what is happening, and apply this across your business to make improvements to operations. You can also share these data visualizations from any device. Read more | KNIME Analytics Platform is an open-source software for creating appropriate data science workflows as per need. Continuously integrating new developments, KNIME makes reusable components accessible to everyone. The platforms intuitive and open interface makes it easy for developers to understand data and design workflows, accordingly. Also, KNIME Hub offered by the same makes it easy for users to drag and drop nodes and components as per choice, without the need for coding. Furthermore, with this software developers can model each step of their data analysis, control the data related workflow of data and ensure that their work is always up to date. With the platform’s native nodes, developers can blend tools from different domains into a single workflow which includes scripting in R & Python, machine learning or connectors to Apache Spark. KNIME Analytics Platform also comes supportive of simple text formats like PDF, CSV, XML, XLS, unstructured data types (documents, networks, images) or time-series data for users to open and combine. Also, this software hosts a series of databases and data warehouses which allows users to connect data from Microsoft SQL, Oracle, Snowflake, Apache Five and more. Read more |
| Pricing Options |
|
|
| SW Score & Breakdown |
93% SW Score The SW Score ranks the products within a particular category on a variety of parameters, to provide a definite ranking system. Read more
|
79% SW Score The SW Score ranks the products within a particular category on a variety of parameters, to provide a definite ranking system. Read more
|
| SaaSworthy Awards | # 13 Highly Rated # 8 Most Popular |
Not Available
|
| Total Features |
10 Features
|
2 Features
|
| Common Features for All |
Ad hoc Analysis
Ad hoc Query
Ad hoc Reports
Benchmarking
Dashboard
Data Analysis
Key Performance Indicators
Profitability Analysis
Strategic Planning
Trend Indicators
|
Ad hoc Analysis
Ad hoc Query
Ad hoc Reports
Benchmarking
Dashboard
Data Analysis
Key Performance Indicators
Profitability Analysis
Strategic Planning
Trend Indicators
|
| Organization Types Supported |
|
|
| Platforms Supported |
|
|
| Modes of Support |
|
|
| API Support |
|
|
| User Rating |
|
|
| Rating Distribution |
|
|
| User Sentiments |
Ease of Use, Excellent Customer Support, Data Visualization Capabilities, Extensive Integrations Slow Loading Times, Limited Visualization Customizations, Steep Learning Curve, Limited SQL Functionality |
Drag and Drop Interface, Open Source Software, Extensive Data Mining Capabilities, Easy Data Integration Steep Learning Curve, Limited Data Visualization, Slow Performance with Large Datasets, Limited Customer Support |
| Review Summary |
Overall, Looker receives positive feedback for its user-friendly interface, robust data visualization capabilities, and ability to connect to a wide range of data sources. Praised for its ease of use and ability to empower business users with self-service analytics, Looker is seen as a valuable tool for data exploration and insights generation. However, some users mention challenges with performance and scalability, particularly when working with large datasets. Additionally, a few reviewers express concerns regarding the cost and complexity of implementation. |
KNIME Analytics Platform is praised for its intuitive drag-and-drop interface, which simplifies data analysis and automation for both beginners and experienced users. Its ability to handle complex data sets and seamlessly integrate with various data sources, including Excel and databases, is highly valued. However, users often highlight a steep learning curve, especially for novices, and some mention performance issues when processing large data volumes. While the platform is considered powerful, some users wish for more advanced visualization and reporting capabilities. Despite these drawbacks, KNIME remains a popular choice for data mining, machine learning tasks, and building robust data pipelines. |
| Read All User Reviews | Read All User Reviews |
AI-Generated from the text of User Reviews
| Pricing Options |
|
|
|
Pricing Plans
Monthly Plans
Annual Plans
|
Looker Custom |
KNIME Analytics Platform Custom |
|
View Detailed Pricing
|
View Detailed Pricing
|
| Screenshots |
+ 2 More
|

|
| Videos |

+ 2 More
|

+ 2 More
|
| Company Details | Located in: Santa Cruz, California | Located in: Austin, Texas |
| Contact Details |
+1‑831‑244‑0340 |
Not available |
| Social Media Handles |
|
Not available |
Looking for the right SaaS
We can help you choose the best SaaS for your specific requirements. Our in-house experts will assist you with their hand-picked recommendations.
Want more customers?
Our experts will research about your product and list it on SaaSworthy for FREE.