Tableau |
95% SW Score The SW Score ranks the products within a particular category on a variety of parameters, to provide a definite ranking system. Read more
Get Free Advice
|
85% SW Score The SW Score ranks the products within a particular category on a variety of parameters, to provide a definite ranking system. Read more
Get Free Advice
|
| Description | Grafana is software that assists companies to monitor everything from Prometheus & Graphite metrics, logs, applications, beehives, power plants, sourdough starters, and custom data sources. It makes metric visualization tools that are more accessible and easy to use across the entire company. Grafana cloud plan collects, analyzes, and alerts users on Graphite and Prometheus metrics and Loki logs on highly available, high-performance, and fully managed Grafana Cloud platforms. Users can get visibility into all data sources and metrics across their teams without jumping through multiple tabs and tools. The platform enables users to get massive query performance and high efficiency for their Prometheus metrics at any scale. Users can also access Grafana Enterprise, which includes access to enterprise plugins that take users' existing data sources and allow them to drop them right into Grafana. This will enable users to get the best out of their complicated and expensive monitoring solutions and databases by visualizing all the data more easily and effectively. Read more | SAP Lumira is a self-service data visualisation and business intelligence software that helps users make decisions more quickly. The programme uses data from throughout the entire organisation to give users access to and the ability to share unmatched knowledge for fearless competition in the contemporary digital market. The SAP Lumira software system includes interactive dashboards, self-service corporate information discovery and visualisation, as well as analytical applications. The application offers cloud and on-premise deployment, a straightforward design canvas that encourages business and IT cooperation and facilitates adoption, and inclusive self-service statistics across the whole business line. Together with a straightforward interface for self-service data visualisation, connectivity, and powerful developer tools, it also integrates the business and IT teams and provides key insights more quickly. It also facilitates access to protected government data. Additionally, it connects SAP Analytics Hub, which gives business users access to all metrics across the organisation, with on-premise data retrieval, dashboards, and analytical applications. Read more |
| Pricing Options |
|
|
| SW Score & Breakdown |
95% SW Score The SW Score ranks the products within a particular category on a variety of parameters, to provide a definite ranking system. Read more
|
85% SW Score The SW Score ranks the products within a particular category on a variety of parameters, to provide a definite ranking system. Read more
|
| SaaSworthy Awards | # 5 Fastest Growing # 2 Most Popular | # 10 Highly Rated |
| Total Features |
8 Features
|
8 Features
|
| Common Features for All |
Data Integration
Data Security
Interactive Dashboard
Key Performance Indicators
OLAP
Predefined Templates
Public Dashboard
Visual Analytics
Widgets
|
Data Integration
Data Security
Interactive Dashboard
Key Performance Indicators
OLAP
Predefined Templates
Public Dashboard
Visual Analytics
Widgets
|
| Organization Types Supported |
|
|
| Platforms Supported |
|
|
| Modes of Support |
|
|
| API Support |
|
|
| User Rating |
|
|
| Rating Distribution |
|
|
| User Sentiments |
Easy to Use Interface, Extensive Customization Options, Powerful Visualization Capabilities, Wide Range of Data Source Integrations Steep Learning Curve, Slow Loading Times, Limited Alerting Functionality, Complex Querying Language |
Intuitive Data Visualization Capabilities, Ease of use, Extensive Integration Capabilities, Comprehensive Data Analysis Features Occasional Performance Issues, Limited Customization Options, Steep Learning Curve, Limited Exporting Functionality |
| Review Summary |
Grafana is widely praised for its powerful visualization capabilities, allowing users to create custom dashboards that provide insightful views of data from a variety of sources. Users appreciate its flexibility, extensive plugin library, and ease of integration with various monitoring tools. However, some users find the initial setup and configuration process complex, and point to limitations in its alerting capabilities. Despite these drawbacks, Grafana remains a popular choice for monitoring and analysis, particularly for those seeking a customizable open-source solution. |
Overall, SAP Lumira is a robust business intelligence and data visualization tool that empowers users to explore and analyze data, create interactive visualizations, and generate insightful reports. Users appreciate its intuitive interface, flexibility, and the wide range of data sources it supports. However, some reviewers have expressed concerns about its pricing, occasional performance issues, and the need for a steeper learning curve compared to simpler tools. Nevertheless, SAP Lumira remains a popular choice for businesses seeking advanced data analysis and visualization capabilities. |
| Read All User Reviews | Read All User Reviews |
AI-Generated from the text of User Reviews
| Pricing Options |
|
|
|
Pricing Plans
Monthly Plans
Annual Plans
|
Free Forever Free Pro $19.00 $19.00 per month Advanced $299.00 $299.00 per month Enterprise Custom |
SAP Lumira Custom |
|
View Detailed Pricing
|
View Detailed Pricing
|
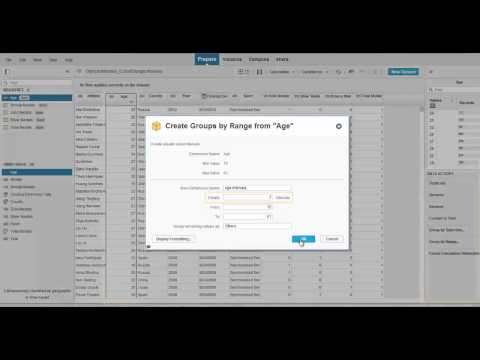
| Screenshots |

+ 3 More
|

+ 1 More
|
| Videos |

|
+ 1 More
|
| Company Details | Located in: New York, New York Founded in: 2014 | Located in: Walldorf, Germany |
| Contact Details |
Not available |
Not available |
| Social Media Handles |
|
Not available |
Looking for the right SaaS
We can help you choose the best SaaS for your specific requirements. Our in-house experts will assist you with their hand-picked recommendations.
Want more customers?
Our experts will research about your product and list it on SaaSworthy for FREE.


