Databox |
95% SW Score The SW Score ranks the products within a particular category on a variety of parameters, to provide a definite ranking system. Read more
Get Free Advice
|
98% SW Score The SW Score ranks the products within a particular category on a variety of parameters, to provide a definite ranking system. Read more
Get Free Advice
|
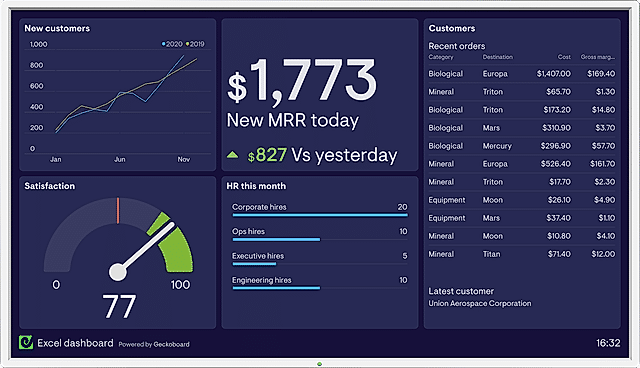
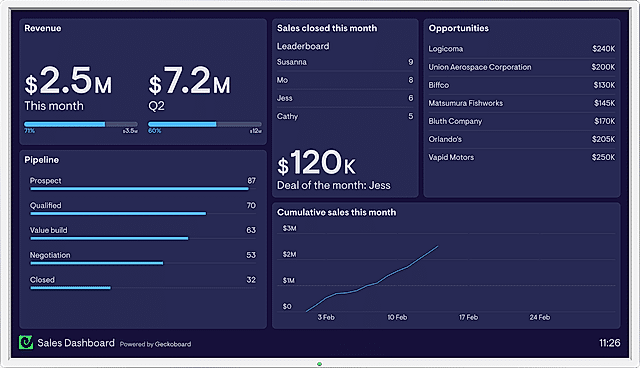
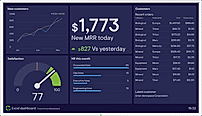
| Description | Grafana is software that assists companies to monitor everything from Prometheus & Graphite metrics, logs, applications, beehives, power plants, sourdough starters, and custom data sources. It makes metric visualization tools that are more accessible and easy to use across the entire company. Grafana cloud plan collects, analyzes, and alerts users on Graphite and Prometheus metrics and Loki logs on highly available, high-performance, and fully managed Grafana Cloud platforms. Users can get visibility into all data sources and metrics across their teams without jumping through multiple tabs and tools. The platform enables users to get massive query performance and high efficiency for their Prometheus metrics at any scale. Users can also access Grafana Enterprise, which includes access to enterprise plugins that take users' existing data sources and allow them to drop them right into Grafana. This will enable users to get the best out of their complicated and expensive monitoring solutions and databases by visualizing all the data more easily and effectively. Read more | Geckoboard is a smart dashboard developed to help you simplify the data obtained from spreadsheets, databases, and applications, and present them in the most vivid way possible. By using real-time metrics, companies can help their teams understand and improve their performance. With more than 60 integrations, you can easily create real-time dashboards to help your team immediately see the impact of their work and make corrections independently. Owners can now let everyone in the organization understand the progress of the entire business, and show the progress of achieving high-level goals, as well as an essential summary of key performance indicators and company goals with Geckoboard. Companies can easily visualize the exact information they need and filter the data to accurately display the information they want; they can also choose a beautifully designed real-time view through Geckoboard's easy-to-use interface. Read more |
| Pricing Options |
|
|
| SW Score & Breakdown |
95% SW Score The SW Score ranks the products within a particular category on a variety of parameters, to provide a definite ranking system. Read more
|
98% SW Score The SW Score ranks the products within a particular category on a variety of parameters, to provide a definite ranking system. Read more
|
| SaaSworthy Awards | # 5 Fastest Growing # 2 Most Popular | # 1 Most Worthy # 2 Highly Rated |
| Total Features |
8 Features
|
10 Features
|
| Common Features for All |
Data Integration
Data Security
Interactive Dashboard
Key Performance Indicators
OLAP
Predefined Templates
Private Dashboard
Public Dashboard
Visual Analytics
Widgets
|
Data Integration
Data Security
Interactive Dashboard
Key Performance Indicators
OLAP
Predefined Templates
Private Dashboard
Public Dashboard
Visual Analytics
Widgets
|
| Organization Types Supported |
|
|
| Platforms Supported |
|
|
| Modes of Support |
|
|
| API Support |
|
|
| User Rating |
|
|
| Rating Distribution |
|
|
| User Sentiments |
Easy to Use Interface, Extensive Customization Options, Powerful Visualization Capabilities, Wide Range of Data Source Integrations Steep Learning Curve, Slow Loading Times, Limited Alerting Functionality, Complex Querying Language |
Ease of Use, Visually Appealing Dashboards, Extensive Integrations, Real-Time Data Updates Limited Customization Options, Occasional Performance Issues (e.g., Slow Loading, Refresh Issues), Limited Functionality, Lack of Advanced Analytics Features |
| Review Summary |
Grafana is widely praised for its powerful visualization capabilities, allowing users to create custom dashboards that provide insightful views of data from a variety of sources. Users appreciate its flexibility, extensive plugin library, and ease of integration with various monitoring tools. However, some users find the initial setup and configuration process complex, and point to limitations in its alerting capabilities. Despite these drawbacks, Grafana remains a popular choice for monitoring and analysis, particularly for those seeking a customizable open-source solution. |
GeckoBoard is a popular tool for creating dashboards and visualizing data from various sources, particularly for tracking key performance indicators (KPIs) and company goals. Users praise its ease of use, particularly for setting up pre-built widgets, and the visually appealing dashboards that can be shared with stakeholders. However, some users note limitations in customization options, data granularity, and integration availability, particularly for more technical data sources. Despite these drawbacks, GeckoBoard is generally well-regarded for its ability to provide a clear and easily digestible overview of key business metrics. |
| Read All User Reviews | Read All User Reviews |
AI-Generated from the text of User Reviews
| Pricing Options |
|
|
|
Pricing Plans
Monthly Plans
Annual Plans
|
Free Forever Free Pro $19.00 $19.00 per month Advanced $299.00 $299.00 per month Enterprise Custom |
Starter $29.00 $35.00 per month Team $125.00 $159.00 per month Team Plus $219.00 $275.00 per month Enterprise Custom |
|
View Detailed Pricing
|
View Detailed Pricing
|
| Screenshots |

+ 3 More
|
+ 3 More
|
| Videos |

|
|
| Company Details | Located in: New York, New York Founded in: 2014 | Located in: London, England Founded in: 2010 |
| Contact Details |
Not available |
Not available |
| Social Media Handles |
|
|
Looking for the right SaaS
We can help you choose the best SaaS for your specific requirements. Our in-house experts will assist you with their hand-picked recommendations.
Want more customers?
Our experts will research about your product and list it on SaaSworthy for FREE.