Prometheus |
95% SW Score The SW Score ranks the products within a particular category on a variety of parameters, to provide a definite ranking system. Read more
Get Free Advice
|
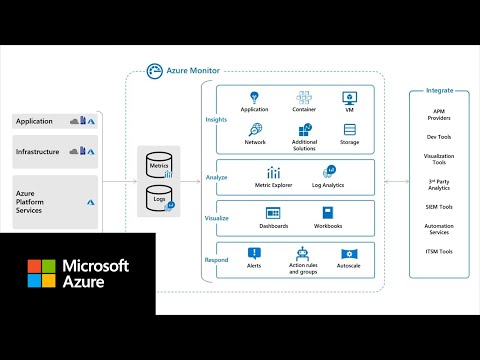
| Description | Grafana is software that assists companies to monitor everything from Prometheus & Graphite metrics, logs, applications, beehives, power plants, sourdough starters, and custom data sources. It makes metric visualization tools that are more accessible and easy to use across the entire company. Grafana cloud plan collects, analyzes, and alerts users on Graphite and Prometheus metrics and Loki logs on highly available, high-performance, and fully managed Grafana Cloud platforms. Users can get visibility into all data sources and metrics across their teams without jumping through multiple tabs and tools. The platform enables users to get massive query performance and high efficiency for their Prometheus metrics at any scale. Users can also access Grafana Enterprise, which includes access to enterprise plugins that take users' existing data sources and allow them to drop them right into Grafana. This will enable users to get the best out of their complicated and expensive monitoring solutions and databases by visualizing all the data more easily and effectively. Read more | Azure Monitor helps you maximize the performance and availability of your applications and proactively identify problems in seconds. Store and analyze all your operational telemetry in a centralized, fully managed, scalable data store that’s optimized for performance and cost. Analyze and optimize the performance of your infrastructure, including virtual machines (VMs), Azure Kubernetes Service (AKS), Azure Storage, and databases. Monitor and diagnose networking issues without logging into your virtual machines. Read more |
| Pricing Options |
|
|
| SW Score & Breakdown |
95% SW Score The SW Score ranks the products within a particular category on a variety of parameters, to provide a definite ranking system. Read more
|
|
| SaaSworthy Awards | # 5 Fastest Growing # 2 Most Popular |
Not Available
|
| Organization Types Supported |
|
|
| Platforms Supported |
|
|
| Modes of Support |
|
|
| API Support |
|
|
| User Rating |
|
|
| Rating Distribution |
|
|
| User Sentiments |
Easy to Use Interface, Extensive Customization Options, Powerful Visualization Capabilities, Wide Range of Data Source Integrations Steep Learning Curve, Slow Loading Times, Limited Alerting Functionality, Complex Querying Language |
Centralized Monitoring, Log Management, Real-time Insights, Customizable Dashboards Complex UI/UX, Limited Third-party Integrations, Occasional Performance Issues, Alert Configuration Challenges |
| Review Summary |
Grafana is widely praised for its powerful visualization capabilities, allowing users to create custom dashboards that provide insightful views of data from a variety of sources. Users appreciate its flexibility, extensive plugin library, and ease of integration with various monitoring tools. However, some users find the initial setup and configuration process complex, and point to limitations in its alerting capabilities. Despite these drawbacks, Grafana remains a popular choice for monitoring and analysis, particularly for those seeking a customizable open-source solution. |
Azure Monitor is a powerful tool for monitoring Azure resources, offering real-time visibility and insights into performance, availability, and security. Users praise its ability to centralize logs, provide detailed metrics, and integrate seamlessly with other Azure services. However, some users report challenges with complexity, specifically for those less familiar with Azure, and highlight the need for more robust non-Azure resource monitoring support. The UI can be complex despite its user-friendly nature, and cost considerations can be a factor, particularly for high-volume logging needs. |
| Pros & Cons |
|
|
| Read All User Reviews | Read All User Reviews |
AI-Generated from the text of User Reviews
| Pricing Options |
|
|
|
Pricing Plans
Monthly Plans
Annual Plans
|
Free Forever Free Pro $19.00 $19.00 per month Advanced $299.00 $299.00 per month Enterprise Custom |
Azure Monitor Others |
|
View Detailed Pricing
|
View Detailed Pricing
|
| Screenshots |

+ 3 More
|

+ 3 More
|
| Videos |

|
+ 2 More
|
| Company Details | Located in: New York, New York Founded in: 2014 | Located in: Redmond, Washington |
| Contact Details |
Not available |
Not available |
| Social Media Handles |
|
|
What are the key differences between Grafana and Azure Monitor?
What are the alternatives to Grafana?
Which SaaS products can Grafana integrate with?
Which product is better for large-scale data visualization?
How do the alerting and notification features of these products differ?
Looking for the right SaaS
We can help you choose the best SaaS for your specific requirements. Our in-house experts will assist you with their hand-picked recommendations.
Want more customers?
Our experts will research about your product and list it on SaaSworthy for FREE.


