Superset |
96% SW Score The SW Score ranks the products within a particular category on a variety of parameters, to provide a definite ranking system. Read more
Get Free Advice
|
95% SW Score The SW Score ranks the products within a particular category on a variety of parameters, to provide a definite ranking system. Read more
Get Free Advice
|
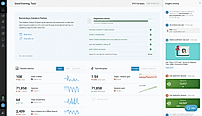
| Description | Databox is an advanced dashboard, ideally suited to all types of businesses to maintain their business needs efficiently. With Databox, customers can see all their performance data in one place, so they have to spend less time checking data from different sources, creating reports, and more time processing information. With its DIY Dashboard Designer tool, anyone can extract the indicators they need, visualize KPIs in various ways, and create beautiful dashboards without coding or design skills. The user can also set targets for specific metrics from any of the 70+ brand integrations or any other data that they integrate into Databox. Databox also provides job reminders for the company; notifications when performance is disabled. With statistics, owners can view a series of achievements for their team and receive suggestions for improving business performance. By using data calculations, users can combine data from any source and easily calculate new indicators. They also have a free package for users to try out their advanced features. Read more | Grafana is software that assists companies to monitor everything from Prometheus & Graphite metrics, logs, applications, beehives, power plants, sourdough starters, and custom data sources. It makes metric visualization tools that are more accessible and easy to use across the entire company. Grafana cloud plan collects, analyzes, and alerts users on Graphite and Prometheus metrics and Loki logs on highly available, high-performance, and fully managed Grafana Cloud platforms. Users can get visibility into all data sources and metrics across their teams without jumping through multiple tabs and tools. The platform enables users to get massive query performance and high efficiency for their Prometheus metrics at any scale. Users can also access Grafana Enterprise, which includes access to enterprise plugins that take users' existing data sources and allow them to drop them right into Grafana. This will enable users to get the best out of their complicated and expensive monitoring solutions and databases by visualizing all the data more easily and effectively. Read more |
| Pricing Options |
|
|
| SW Score & Breakdown |
96% SW Score The SW Score ranks the products within a particular category on a variety of parameters, to provide a definite ranking system. Read more
|
95% SW Score The SW Score ranks the products within a particular category on a variety of parameters, to provide a definite ranking system. Read more
|
| SaaSworthy Awards | # 2 Most Worthy # 1 Highly Rated | # 5 Fastest Growing # 2 Most Popular |
| Total Features |
8 Features
|
8 Features
|
| Common Features for All |
Data Integration
Data Security
Interactive Dashboard
Key Performance Indicators
OLAP
Predefined Templates
Public Dashboard
Visual Analytics
Widgets
|
Data Integration
Data Security
Interactive Dashboard
Key Performance Indicators
OLAP
Predefined Templates
Public Dashboard
Visual Analytics
Widgets
|
| Organization Types Supported |
|
|
| Platforms Supported |
|
|
| Modes of Support |
|
|
| API Support |
|
|
| User Rating |
|
|
| Rating Distribution |
|
|
| User Sentiments |
Easy to Use Interface, Extensive Integrations, Beautiful Visualizations, Customizable Dashboards Limited Customization Options, Inconsistent Data History, Occasional Bugs and Glitches, Limited Features in Free Plan |
Easy to Use Interface, Extensive Customization Options, Powerful Visualization Capabilities, Wide Range of Data Source Integrations Steep Learning Curve, Slow Loading Times, Limited Alerting Functionality, Complex Querying Language |
| Review Summary |
Overall, users appreciate Databox's user-friendly interface, customizable dashboards, and ability to integrate data from various sources. The platform is praised for its ease of use, time-saving capabilities, and the ability to create insightful visualizations. However, some users have reported occasional glitches, limited customer support, and a learning curve associated with setting up the platform. Additionally, pricing concerns and the need for more advanced features have been mentioned in some reviews. |
Grafana is widely praised for its powerful visualization capabilities, allowing users to create custom dashboards that provide insightful views of data from a variety of sources. Users appreciate its flexibility, extensive plugin library, and ease of integration with various monitoring tools. However, some users find the initial setup and configuration process complex, and point to limitations in its alerting capabilities. Despite these drawbacks, Grafana remains a popular choice for monitoring and analysis, particularly for those seeking a customizable open-source solution. |
| Read All User Reviews | Read All User Reviews |
AI-Generated from the text of User Reviews
| Pricing Options |
|
|
|
Pricing Plans
Monthly Plans
Annual Plans
|
Starter Free Professional $135.00 $169.00 per month Performer $231.00 $289.00 per month |
Free Forever Free Pro $19.00 $19.00 per month Advanced $299.00 $299.00 per month Enterprise Custom |
|
View Detailed Pricing
|
View Detailed Pricing
|
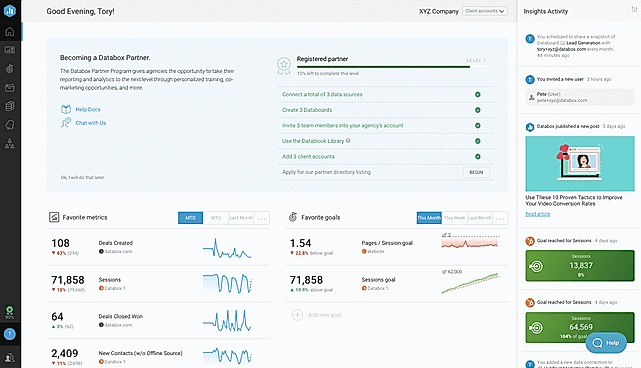
| Screenshots |
+ 2 More
|

+ 3 More
|
| Videos |
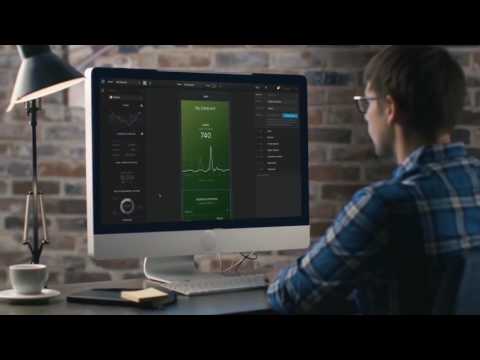
+ 2 More
|

|
| Company Details | Located in: Boston, Massachusetts | Located in: New York, New York Founded in: 2014 |
| Contact Details |
Not available |
Not available |
| Social Media Handles |
|
|
Looking for the right SaaS
We can help you choose the best SaaS for your specific requirements. Our in-house experts will assist you with their hand-picked recommendations.
Want more customers?
Our experts will research about your product and list it on SaaSworthy for FREE.
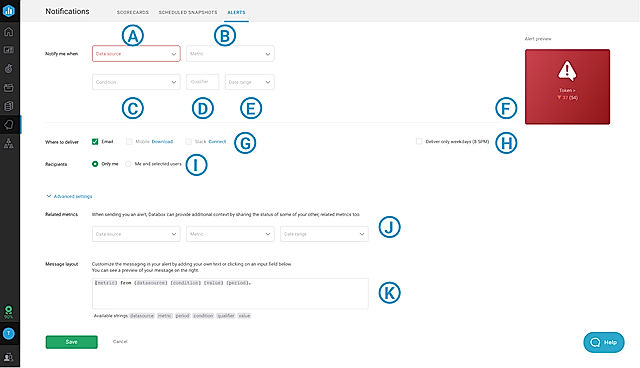
![How to create Alerts [Example]](http://images.saasworthy.com/tr:w-864,h-368,c-at_max,e-sharpen-1/databox_5903_screenshot_1580126761_zsqxm.gif)


![How to create Alerts [Example]](http://images.saasworthy.com/tr:w-84,h-84,c-at_max,e-sharpen-1/databox_5903_screenshot_1580126761_zsqxm.gif)


